
Skip to Content
chevron-left chevron-right chevron-up chevron-right chevron-left arrow-back star phone quote checkbox-checked search wrench info shield play connection mobile coin-dollar spoon-knife ticket pushpin location gift fire feed bubbles home heart calendar price-tag credit-card clock envelop facebook instagram twitter youtube pinterest yelp google reddit linkedin envelope bbb pinterest homeadvisor angies

What Are the Top Real Time Monitoring Sensors in 2026?

Real-time monitoring is no longer limited to factory floors. In 2026, connected sensors help teams track equipment, buildings, supply chains, and environmental conditions as they change. The right Real-Time Monitoring Sensor can reveal a rising motor temperature, a pressure drop, or a leak before it becomes a costly disruption. Small signals matter.

Physicist Lord Kelvin captured the value of measurement in his 1883 lecture: “When you can measure what you are speaking about, and express it in numbers, you know something about it.” His principle remains relevant to sensor selection: data is useful only when it is dependable and understood in context. A reading without calibration, location, or a clear response plan may mislead more than it helps.

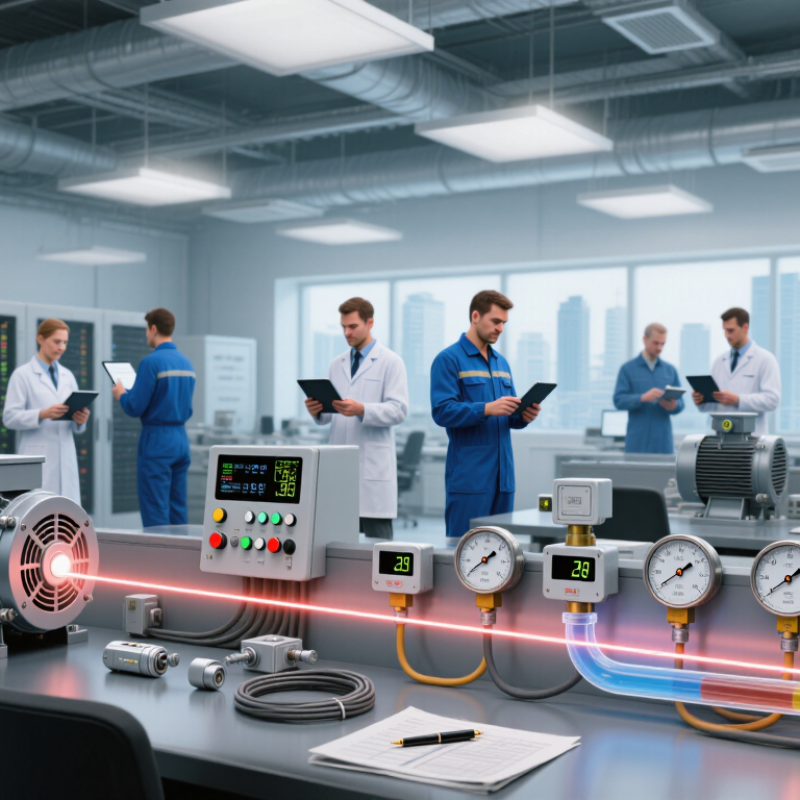
This guide explores leading sensor types for real-time monitoring in 2026, including temperature, vibration, pressure, gas, humidity, flow, and optical sensors. It compares their practical strengths, typical applications, and trade-offs in accuracy, response time, connectivity, and maintenance. Some systems work beautifully in a lab, then struggle with dust, vibration, or changing temperatures. That deserves a closer look. The strongest choice is not always the newest device; it is the sensor that fits the conditions, produces trustworthy readings, and supports timely decisions.
What Are the Top Real Time Monitoring Sensors in 2026?

What Real-Time Monitoring Sensors Measure

Real-time monitoring sensors turn changing physical conditions into readings operators can use. What they measure depends on the environment and the risk being watched. Temperature sensors track heat in equipment, rooms, or stored goods. Humidity probes measure moisture in the air, which can affect materials and indoor conditions. Pressure sensors detect changes in pipes, tanks, or ventilation systems. Small shifts matter. For example, a gradual pressure drop may point to a leak, while a short temperature spike could signal an overloaded motor. One reading alone rarely tells the whole story.

Other sensors measure vibration, flow, liquid level, gas concentration, or electrical current. Vibration sensors can reveal unusual movement in a rotating machine before visible damage appears. Flow meters show how quickly liquids or gases move through a line; level sensors track how much material remains in a tank. Gas sensors detect specific substances in the surrounding air, while current sensors help identify changing electrical loads. Placement matters. A poorly located sensor may report a neat number that misses the real problem. Readings also depend on calibration, sampling rate, and local conditions. Those details are easy to overlook. A sensor is useful, but it is not a substitute for checking whether its data fits what is happening on site.

How Sensors Capture and Transmit Live Data

Real-time monitoring begins when a sensor turns a physical change into a measurable signal. A temperature sensor tracks heat near a pipe; a pressure sensor detects changes inside a line. Vibration sensors pick up movement in motors, while optical sensors measure light or surface changes. Small differences matter. A loose sensor can report the machine’s casing temperature instead of the air around it.

Inside the sensor, a sensing element responds to its surroundings. Electronics convert that response into a digital reading, then attach a timestamp and send it to a gateway or monitoring system. Some devices transmit every second; others send data in scheduled bursts to conserve power. Wired connections can offer steady delivery, while wireless links depend on distance, obstacles, and network conditions. A gateway may filter noisy readings before forwarding them, but filtering can also hide brief events. That trade-off deserves attention. A clean dashboard can still mislead.

Reliable live data needs more than fast transmission. Place sensors where they measure the condition that matters, and compare readings against a trusted reference during calibration. Watch for drift, dust, loose mounts, and depleted batteries. These problems are easy to miss. Even a well-designed system can lose data when connectivity drops, so local storage or clear fault alerts are useful safeguards. No setup stays perfect forever. Rechecking assumptions is part of monitoring, not a sign that the system failed.

Leading Types of Real-Time Monitoring Sensors in 2026

Temperature, humidity, pressure, vibration, gas, and flow sensors remain the core types of real-time monitoring in 2026. Each reveals a different condition: a pressure change in a pipe, excess moisture in a storage room, or unusual vibration from rotating equipment. The best choice depends on what needs attention and how quickly staff must respond.

Temperature and humidity sensors help track cold rooms, server spaces, and production areas. Pressure and flow sensors can flag leaks, blockages, or unstable delivery. Vibration sensors detect changes in motors and pumps before visible damage appears. Gas sensors monitor indoor air for specified gases, while current sensors can show whether electrical equipment is drawing unusual power. Placement matters. A sensor beside a warm motor may report a misleading room temperature.

Useful systems pair sensor readings with clear alerts and regular calibration. A sudden spike may signal a fault, but it could also come from a loose connection or routine maintenance. That distinction matters. Teams should compare readings with operating conditions and check that alerts reach someone who can act. More sensors do not automatically mean better monitoring; poorly placed devices can create noise and false confidence. Reviewing a few real incidents can reveal gaps in coverage, though that review is easy to postpone.

Where Real-Time Monitoring Sensors Are Used

Real-time monitoring sensors are used wherever conditions can change faster than people can inspect them. In factories, vibration and temperature sensors track motors, pumps, and conveyor bearings. A rising vibration reading can prompt maintenance before a line stops. Still, readings need context: a sensor can flag a change, but it cannot explain every cause.

Buildings use occupancy, temperature, humidity, and carbon dioxide sensors to adjust ventilation and heating room by room. The International Energy Agency’s 2023 buildings report says buildings account for about 30% of global final energy use and 26% of energy-related emissions. That makes careful monitoring useful, especially in busy offices and schools. Small changes matter. In clinics, wearable and bedside sensors help staff follow heart rate, oxygen levels, and temperature; alerts support observation, not diagnosis on their own.

Outdoor air sensors are placed near roads, industrial areas, and schools to reveal local pollution patterns. The World Health Organization estimates ambient air pollution caused 4.2 million premature deaths in 2019, underscoring the value of timely exposure data. On farms, soil-moisture and weather sensors help guide irrigation. Agriculture accounts for roughly 70% of global freshwater withdrawals, according to UN-Water. These systems can miss local variation, though. A sensor in one field corner may not represent the whole field. Real-time data is useful, but placement and calibration still need human judgment.

What Are the Top Real Time Monitoring Sensors in 2026? - Where Real-Time Monitoring Sensors Are Used

Sensor Type What It Measures Typical Monitoring Cadence Common Applications Real-Time Value
RTD or Thermocouple Temperature, reported in °C or °F About once per second to once every 10 seconds, depending on the sensor and system Industrial processes, HVAC systems, cold storage, equipment and environmental monitoring Tracks temperature changes and supports alarms when readings move outside configured limits.
Pressure Transducer Liquid or gas pressure, commonly in Pa, kPa, bar or psi Several readings per second to several dozen readings per second in many monitoring systems Pipelines, pumps, boilers, hydraulic equipment and water distribution networks Helps identify pressure drops, blockages, leaks and potentially unsafe pressure conditions.
Vibration Accelerometer Machine vibration and acceleration, commonly in m/s² or g Waveforms are often sampled at thousands of samples per second; summary values may be reported less frequently Motors, fans, pumps, gearboxes, bearings and other rotating machinery Vibration patterns can reveal imbalance, misalignment or bearing wear before equipment failure.
Ultrasonic Flow Sensor Fluid flow rate or flow velocity Often one to several updates per second, depending on the instrument and flow conditions Water and wastewater networks, process lines, building services and industrial fluid systems Provides ongoing flow data without requiring a moving component inside many pipe-mounted designs.
Electrochemical Gas Sensor Concentrations of specific gases, such as carbon monoxide or oxygen Typically updated every few seconds to about once per minute, depending on the sensor and system Workplace safety, confined spaces, industrial facilities and indoor air monitoring Can trigger alerts when a monitored gas reaches a configured exposure or safety threshold.
Optical Particulate Matter Sensor Airborne particle concentrations, commonly reported as PM₂.₅ and PM₁₀ in µg/m³ Commonly updated every few seconds to once per minute Indoor air-quality systems, outdoor air stations, buildings and ventilation monitoring Shows changing particle levels that can inform ventilation decisions and air-quality alerts.
pH Sensor Acidity or alkalinity on the pH scale Often updated every few seconds to tens of seconds after the reading stabilizes Water treatment, wastewater processes, aquaculture, laboratories and industrial liquid processes Supports process control and alerts when liquid chemistry moves outside a target range.
Dissolved Oxygen Sensor Dissolved oxygen in water, commonly in mg/L or percent saturation Typically updated every few seconds to about once per minute, depending on the probe and installation Wastewater treatment, aquaculture, rivers, lakes and environmental water-quality monitoring Helps operators track oxygen conditions that affect biological treatment and aquatic life.

Monitoring cadence is indicative rather than guaranteed. Actual update rates depend on sensor response time, sampling settings, installation conditions and the connected monitoring system.

How to Choose Sensors for a Monitoring System

Choose sensors by the decision the system must support, not by the number of readings on a dashboard. A cold-storage room may need calibrated temperature probes and door contacts; a pump station may need vibration, pressure, and flow sensors. Check measurement range, accuracy, response time, sampling interval, and calibration needs. A fast sensor is not useful if its readings drift unnoticed.

The World Health Organization’s 2021 air-quality guidelines set annual PM2.5 at 5 µg/m³ and 24-hour PM2.5 at 15 µg/m³. These are health guidelines, not sensor specifications. Still, they show why detection limits and calibration matter when selecting particulate sensors. The World Meteorological Organization reported a global CO2 average of 420.0 ppm for 2023, up 2.3 ppm from 2022. That is not an indoor alarm threshold. It is a reminder to match a gas sensor’s range to the actual environment.

Then test the sensor where it will operate. Dust, condensation, vibration, and long cable runs can distort readings. Compare the sensor’s stated accuracy with the smallest change that would prompt action. Also check data gaps, power needs, and how often calibration requires access to the device. The awkward part: a lower-cost sensor may fit the budget but need more frequent checks. A clean dashboard can hide that maintenance burden.